Optimizing Jest Tests for Blazing Fast Feedback on Windows
Jest has become a popular testing framework for JavaScript applications, especially those built with React. While it shines on macOS and Linux, Windows users can sometimes encounter significant slowdowns. This post details how to identify performance bottlenecks in Jest tests on Windows and shares techniques to achieve lightning-fast feedback.
The Problem: Slow Tests on Windows
You recently joined a React project and were met with a six-minute wait for Jest test results – unacceptable for a smooth development workflow. The project, primarily developed on macOS, had only 300 test suites and around 1,000 individual tests. Investigating further revealed this slowness is a known issue for Jest on Windows.
Solution: Profiling and Mocking
To pinpoint the bottlenecks, you leveraged Node’s built-in profiling capabilities via Chrome DevTools. Here’s a step-by-step guide on how to profile Jest tests using Chrome DevTools:
- Run Jest with Debug Mode: Pass the
-inspect-brkargument to thenodecommand when running Jest. This puts the tests in debug mode, pausing at the first line. - Open Chrome DevTools: Navigate to
chrome://inspect/in Chrome and locate the Jest process under “Target.” Click “inspect” to open the developer tools window for the Jest process.
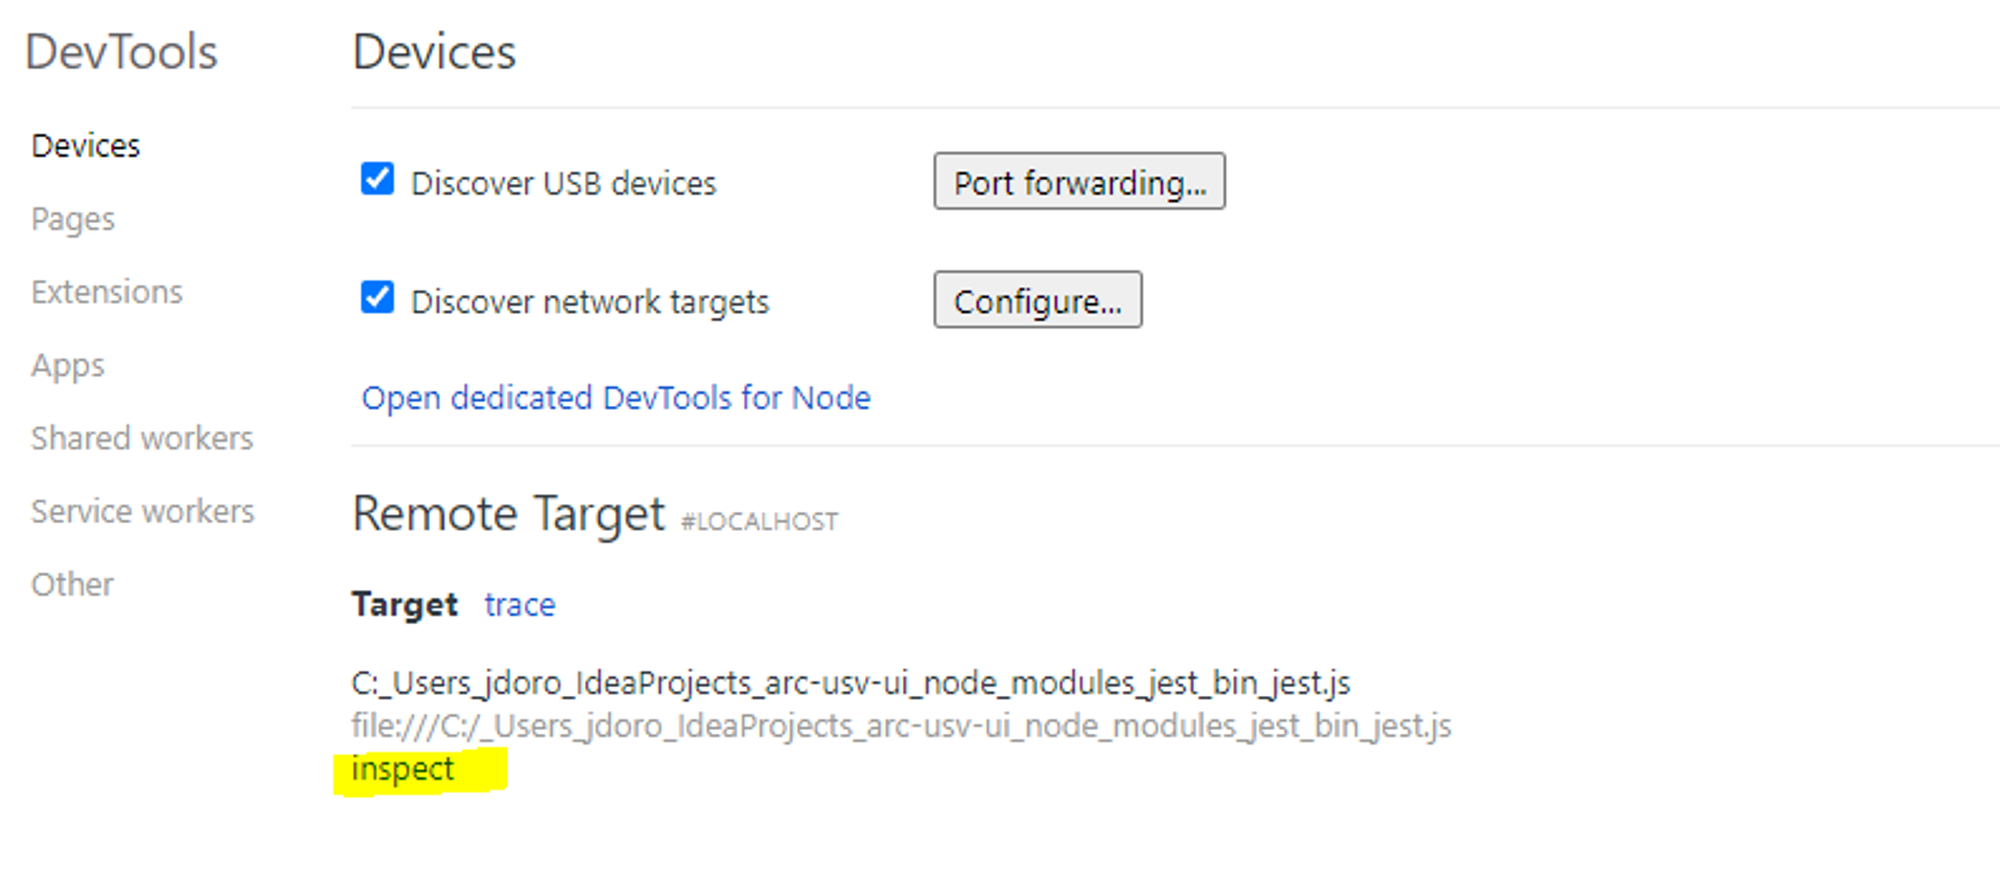
Chrome DevTools Inspect Jest Process
- Start Profiling: In the DevTools window, go to the “Profiles” tab and click “Start.”
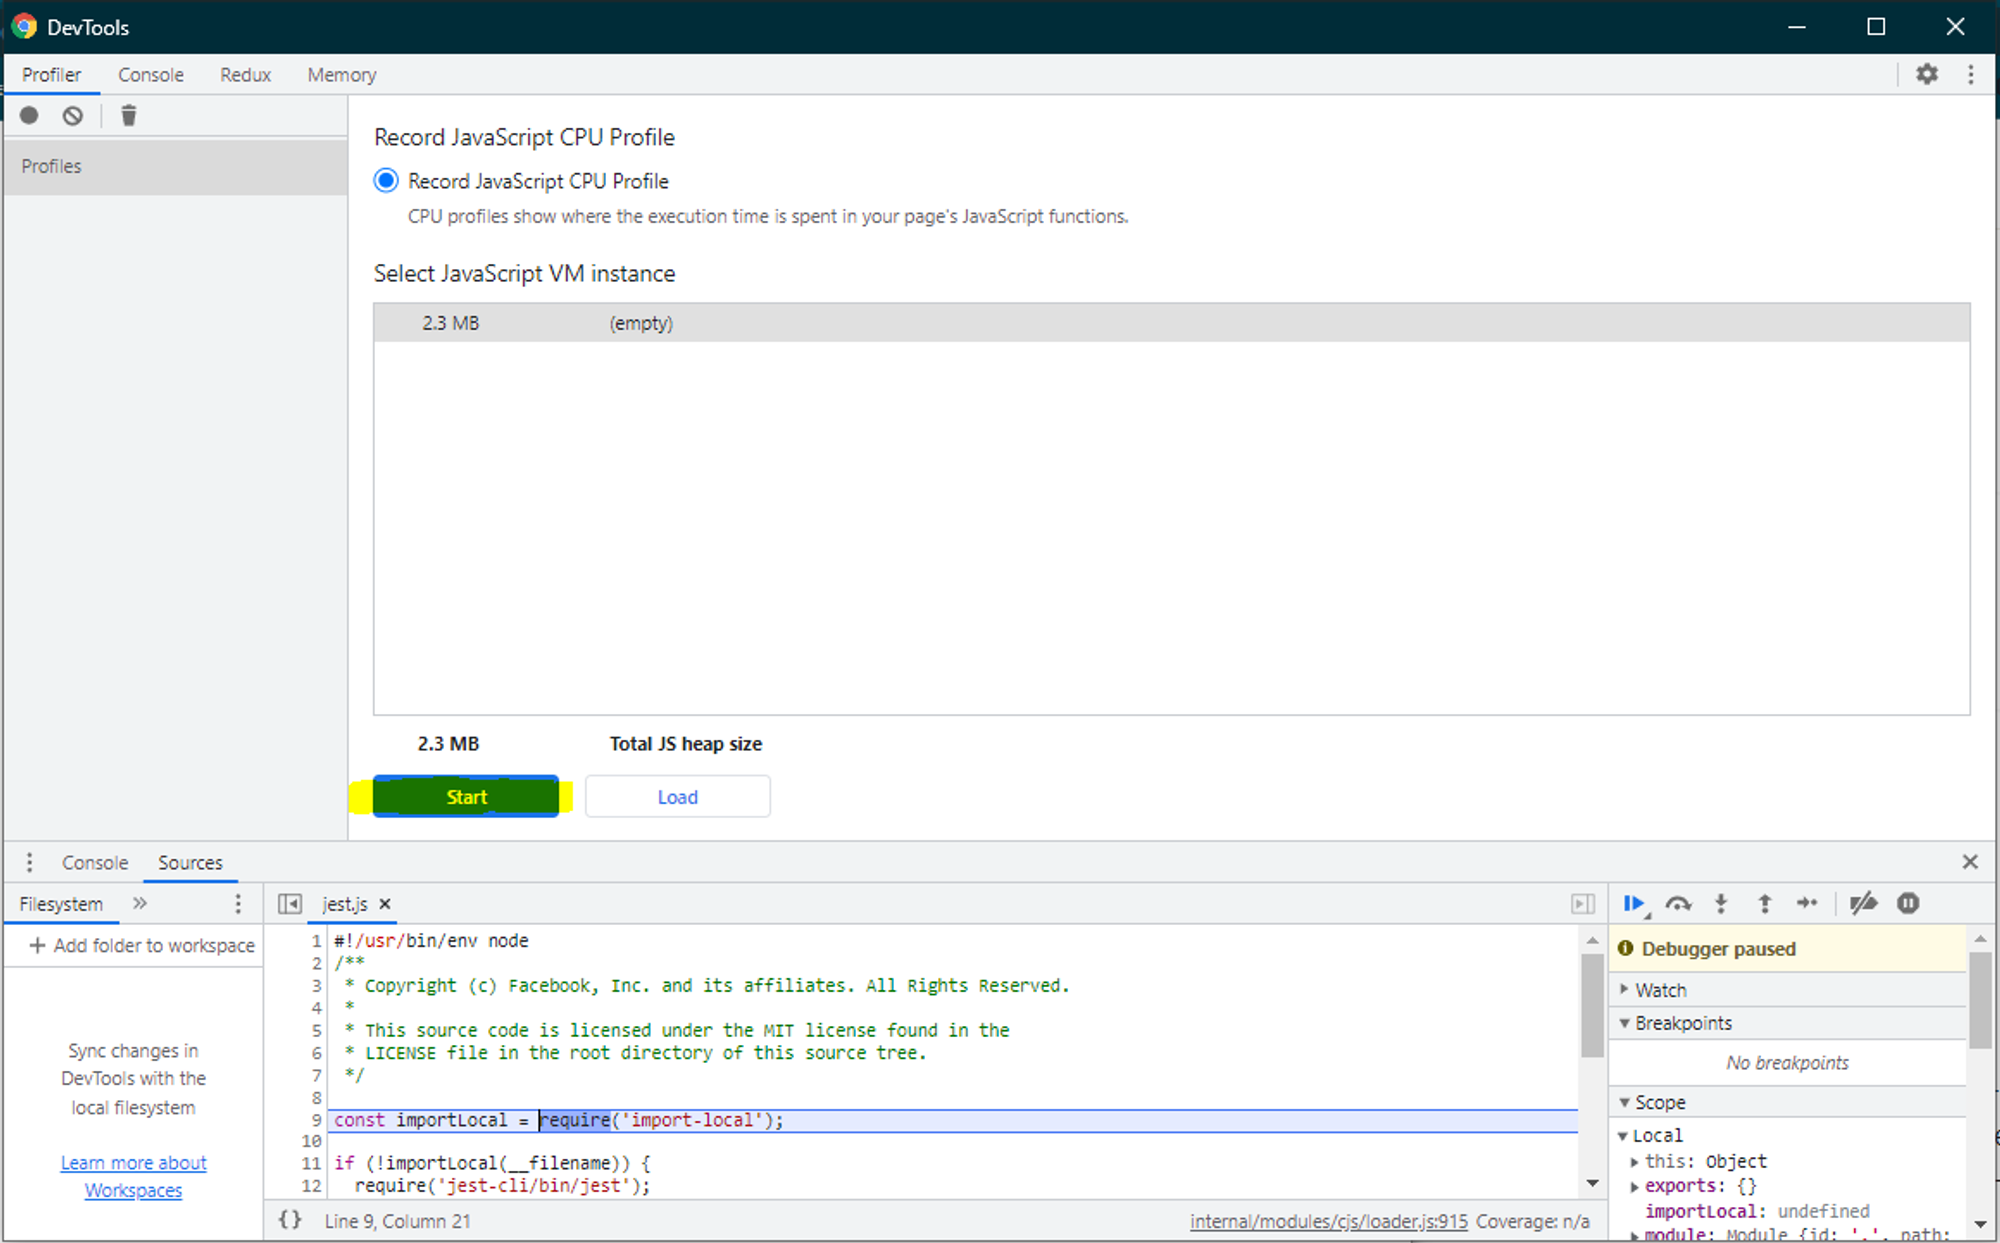
Chrome DevTools Profiling
- Run the Tests: Monitor the terminal where Jest is running. Once the tests finish, switch back to DevTools and click “Stop” in the Profiles tab.
Analyzing the Profile
The initial profile revealed two key areas:
- Jest Setup (Red Circle): This section represents Jest’s internal setup and is unaffected by your code.
- Module Registry (Blue Circle): This part reflects Jest building the module registry for each test suite. It traverses the dependency tree of every imported file, which can be time-consuming.
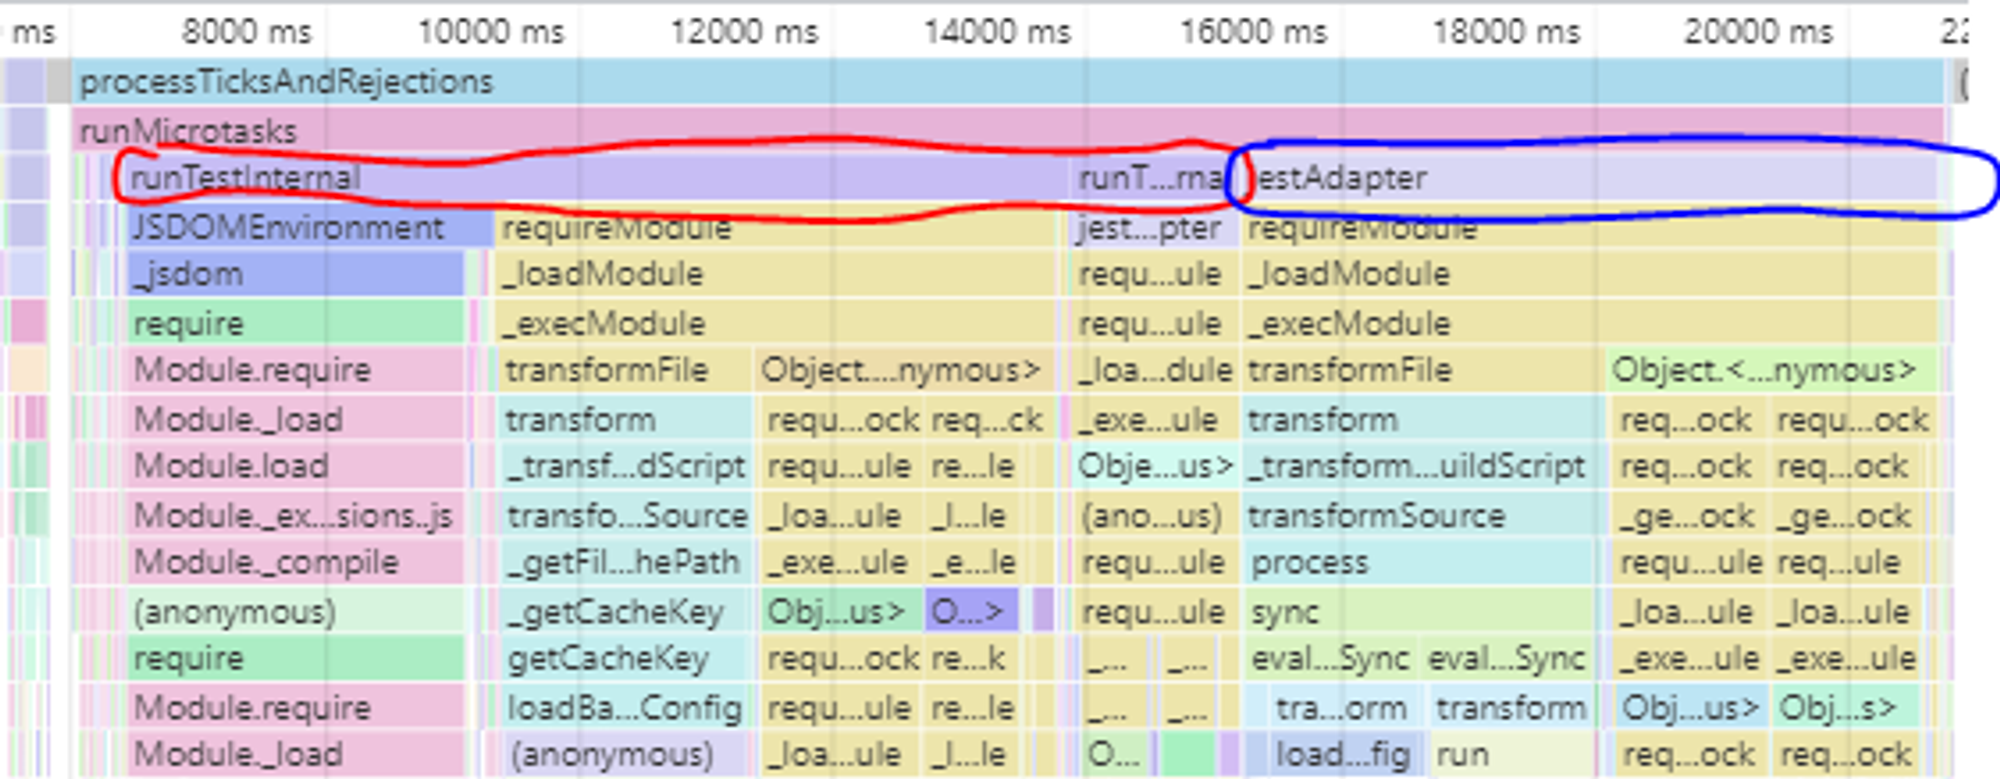
Profile Output Showing Slow Tests
Mocking to the Rescue
One of Jest’s strengths is built-in mocking, but it comes at a cost. Jest rebuilds the module registry for every test suite. To minimize this overhead, you implemented two mocking strategies:
- Isolating Dependencies (Failed): Initially, lets try Jest’s
jest.mock({{insert module path here}})syntax to auto-mock dependencies. However, profiling showed minimal improvement. This is because Jest still needs to build the module registry to understand the exposed interface it needs to mock. - Manual Mocking (Success): introducing Jest’s mock factory syntax
jest.mock({{insert module path here}}, () => { return { foo: jest.func() } }), allowing you to define specific mocks for each dependency. This significantly reduced the module registry build time, as seen in the profile comparison.
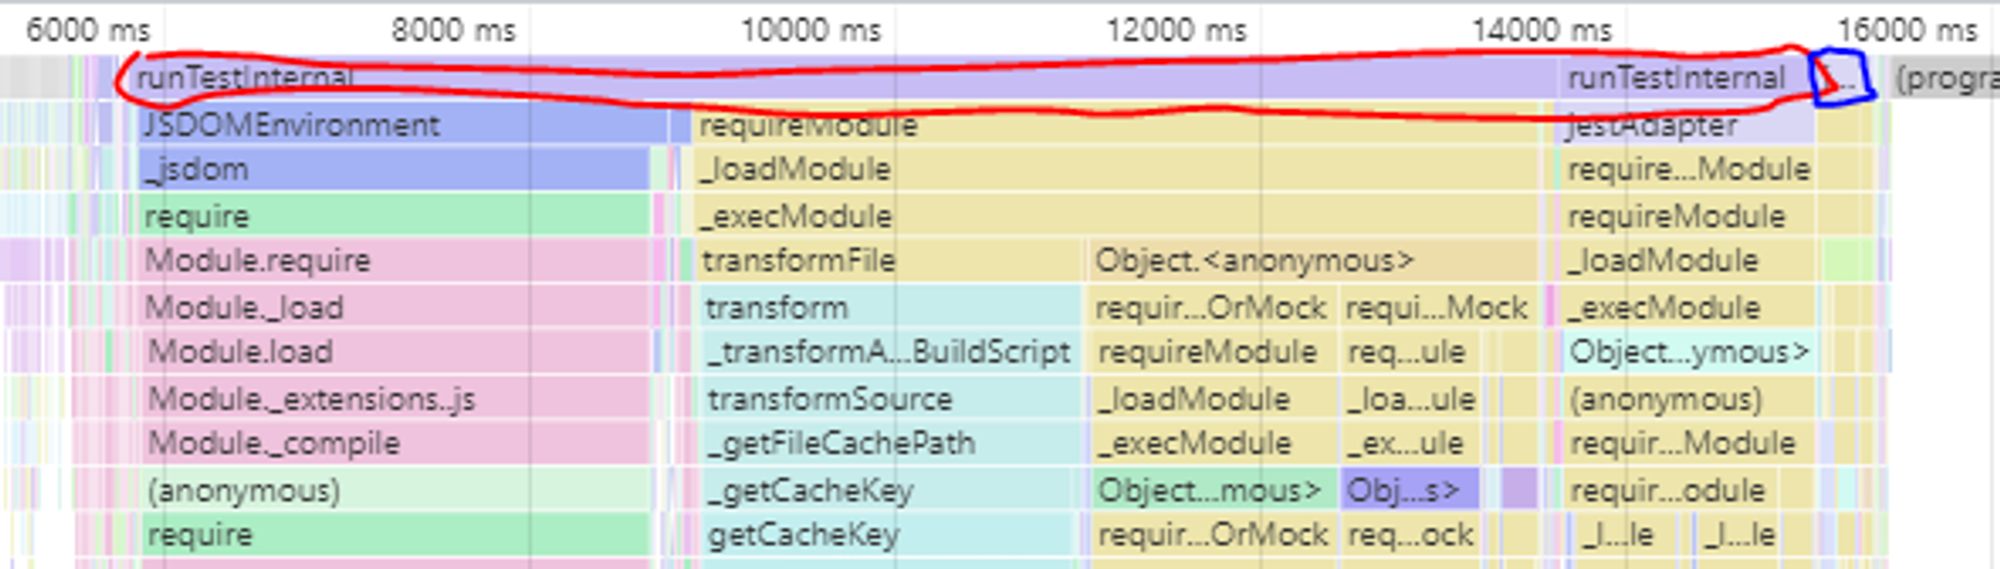
Profile Output Showing Improved Tests
Now you can see, through the scale at the top, that both the red and blue circles have shrunk, indicating a faster test setup and module registry.
Beyond Mocking: Test Efficiency
While mocking helped, another performance pitfall was identified: bringing in unnecessary dependencies just for testing. Focusing on writing lean, efficient tests that target the core functionality can further improve performance.
Results and Conclusion
By applying these techniques to the slowest tests, the execution time was cut from six minutes to two minutes – a significant improvement. As you extend these optimizations across the codebase, the test suite runtime is expected to drop to a much faster 30 seconds.
Additional Tips:
- Consider using a test runner like
jest-runner-rsthat leverages Rust for potentially faster execution. - Explore alternative mocking libraries like
sinonfor more granular control.
Remember, well-performing tests provide valuable feedback and keep development cycles efficient. By understanding Jest’s behavior on Windows and implementing these optimization techniques, you can achieve a blazing-fast testing experience.